描述
可观测性 Observability
对线上应用进行观测、监控、预警…
● 健康状况【组件状态、存活状态】Health
● 运行指标【cpu、内存、垃圾回收、吞吐量、响应成功率…】Metrics
● 链路追踪
● …
实战
新建项目-boot3-14-actuator
新建模块
boot3-13-actuator创建模块
| 项 | 值 |
|---|---|
| 名称 | boot3-14-actuator |
| 位置 | D:\Study-Java\2023\SpringBoot3-Study |
| 语言 | Java |
| 类型 | Maven |
| 组 | com.atguigu |
| 工件 | boot3-14-actuator |
| 软件包名称 | com.atguigu.boot3.actuator |
| JDK | 版本:17 供应商:Eclipse Temurin(AdoptOpenJDK HotSpot)17.0.8 位置:C:\Users\Administrator.jdks\temurin-17.0.8 |
| Java | 17 |
- SpringBoot
3.2.0 - 依赖项目
Developer Tools-- LombokWeb-- Spring WebOps-- Spring Boot Actuator
场景引入
<dependency><groupId>org.springframework.boot</groupId><artifactId>spring-boot-starter-actuator</artifactId></dependency>
暴露指标
management:endpoints:enabled-by-default: true #暴露所有端点信息web:exposure:include: '*' #以web方式暴露
访问数据
● 访问
● http://localhost:8080/actuator
● http://localhost:8080/actuator/beans
● http://localhost:8080/actuator/configprops
● http://localhost:8080/actuator/metrics
● http://localhost:8080/actuator/metrics/jvm.gc.pause
● http://localhost:8080/actuator/endpointName/detailPath
Endpoint
1.常用端点
常用:threaddump、heapdump、metrics
| ID | 描述 |
|---|---|
| auditevents | 暴露当前应用程序的审核事件信息。需要一个 AuditEventRepository 组件。 |
| beans | 显示应用程序中所有 Spring Bean 的完整列表。 |
| caches | 暴露可用的缓存。 |
| conditions | 显示自动配置的所有条件信息,包括匹配或不匹配的原因。 |
| configprops | 显示所有 @ConfigurationProperties。 |
| env | 暴露 Spring 的属性 ConfigurableEnvironment |
| flyway | 显示已应用的所有Flyway数据库迁移。 需要一个或多个 Flyway 组件。 |
| health | 显示应用程序运行状况信息。 |
| httptrace | 显示 HTTP 跟踪信息(默认情况下,最近 100 个 HTTP 请求-响应)。 需要一个 HttpTraceRepository 组件。 |
| info | 显示应用程序信息。 |
| integrationgraph | 显示 Spring integrationgraph 。 需要依赖 spring-integration-core。 |
| loggers | 显示和修改应用程序中日志的配置。 |
| liquibase | 显示已应用的所有 Liquibase 数据库迁移。 需要一个或多个 Liquibase 组件。 |
| metrics | 显示当前应用程序的“指标”信息。 |
| mappings | 显示所有 @RequestMapping 路径列表。 |
| scheduledtasks | 显示应用程序中的计划任务。 |
| sessions | 允许从 Spring Session 支持的会话存储中检索和删除用户会话。 需要使用 Spring Session 的基于 Servlet 的 Web 应用程序。 |
| shutdown | 使应用程序正常关闭。默认禁用。 |
| startup | 显示由 ApplicationStartup 收集的启动步骤数据。 需要使用 SpringApplication 进行配置 BufferingApplicationStartup。 |
| threaddump | 执行线程转储。 |
| heapdump | 返回 hprof 堆转储文件。 |
| jolokia | 通过 HTTP 暴露 JMX bean(需要引入 Jolokia,不适用于 WebFlux)。 需要引入依赖 jolokia-core。 |
| logfile | 返回日志文件的内容(如果已设置 logging.file.name 或 logging.file.path 属性)。 支持使用 HTTPRange 标头来检索部分日志文件的内容。 |
| prometheus | 以 Prometheus 服务器可以抓取的格式公开指标。 需要依赖 micrometer-registry-prometheus。 |
2.定制端点
● 健康监控:返回存活、死亡
● 指标监控:次数、率
(1)健康监控-HealthEndpoint
- MyHahaComponent
package com.atguigu.boot3.actuator.component;import org.springframework.stereotype.Component;@Componentpublic class MyHahaComponent {public int check() {//业务代码判断这个组件是否为存活状态return 1;}}
- MyHahaHealthIndicator
package com.atguigu.boot3.actuator.health;import com.atguigu.boot3.actuator.component.MyHahaComponent;import jakarta.annotation.Resource;import org.springframework.boot.actuate.health.AbstractHealthIndicator;import org.springframework.boot.actuate.health.Health;import org.springframework.stereotype.Component;/*** 1. 通过实现 HealthIndicator 接口来定制组件的健康状态对象(Health) 返回* 2. 通过继承 AbstractHealthIndicator 实现 doHealthCheck 返回*/@Componentpublic class MyHahaHealthIndicator extends AbstractHealthIndicator {@ResourceMyHahaComponent myHahaComponent;/*** 健康检查* @param builder* @throws Exception*/@Overrideprotected void doHealthCheck(Health.Builder builder) throws Exception {//自定义检查方法int check = myHahaComponent.check();if(check == 1) {//存活builder.up().withDetail("code","1000").withDetail("msg","活的很健康").withDetail("data","我的名字是 Haha").build();} else {//下线builder.down().withDetail("code","1001").withDetail("msg","死掉了").withDetail("data","我的名字是 Haha").build();}}}
- 配置文件
server.port= 9000#通过 web 方式暴露所有监控端点management.endpoints.web.exposure.include=*management.endpoint.health.enabled=truemanagement.endpoint.health.show-details=always
- 测试,UP 的情况,访问 http://localhost:9000/actuator/health
{"status":"UP","components":{"diskSpace":{"status":"UP","details":{"total":604120281088,"free":525610569728,"threshold":10485760,"path":"D:\\v_hwhao\\学习\\Code\\2023\\Java\\SpringBoot3-Study\\.","exists":true}},"myHaha":{"status":"UP","details":{"code":"1000","msg":"活的很健康","data":"我的名字是 Haha"}},"ping":{"status":"UP"}}}
- 测试,Down 的情况,修改
check()返回2,访问 http://localhost:9000/actuator/health
{"status":"DOWN","components":{"diskSpace":{"status":"UP","details":{"total":604120281088,"free":525610569728,"threshold":10485760,"path":"D:\\v_hwhao\\学习\\Code\\2023\\Java\\SpringBoot3-Study\\.","exists":true}},"myHaha":{"status":"DOWN","details":{"code":"1001","msg":"死掉了","data":"我的名字是 Haha"}},"ping":{"status":"UP"}}}
(2)指标监控-MetricsEndpoint
- 修改 MyHahaComponent
package com.atguigu.boot3.actuator.component;import io.micrometer.core.instrument.Counter;import io.micrometer.core.instrument.MeterRegistry;import org.springframework.stereotype.Component;@Componentpublic class MyHahaComponent {/*** 计数器*/Counter counter = null;/*** 有参构造函数* 注入 MeterRegistry,保存和统计所有指标* @param meterRegistry 指标统计参数*/public MyHahaComponent(MeterRegistry meterRegistry) {//得到一个名为 myhaha.hello 的计数器counter = meterRegistry.counter("myhaha.hello");}public int check() {//业务代码判断这个组件是否为存活状态return 1;}public String hello() {//方法被调用,计数器 + 1counter.increment();return "hello";}}
- 新建控制器- HelloController
package com.atguigu.boot3.actuator.controller;import com.atguigu.boot3.actuator.component.MyHahaComponent;import jakarta.annotation.Resource;import org.springframework.web.bind.annotation.GetMapping;import org.springframework.web.bind.annotation.RestController;@RestControllerpublic class HelloController {@ResourceMyHahaComponent myHahaComponent;@GetMapping("hello")public String hello() {//业务调用return myHahaComponent.hello();}}
测试,
- 多次访问 http://localhost:9000/hello
输出
{"name":"myhaha.hello","measurements":[{"statistic":"COUNT","value":8}],"availableTags":[]}
监控案例落地
基于 Prometheus + Grafana
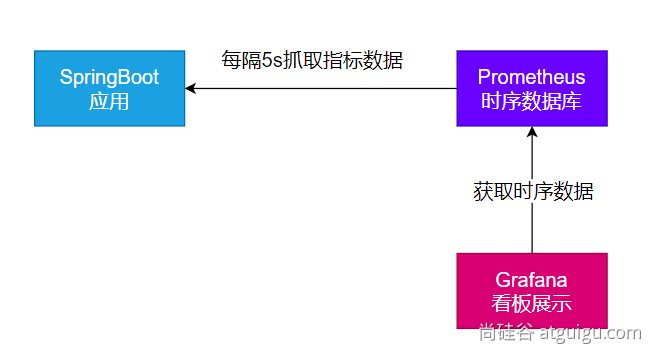
1.安装 Prometheus + Grafana
#安装prometheus:时序数据库docker run -p 9090:9090 -d \-v pc:/etc/prometheus \prom/prometheus#安装grafana;默认账号密码 admin:admindocker run -d --name=grafana -p 3000:3000 grafana/grafana
2.导入依赖
<dependency><groupId>org.springframework.boot</groupId><artifactId>spring-boot-starter-actuator</artifactId></dependency><dependency><groupId>io.micrometer</groupId><artifactId>micrometer-registry-prometheus</artifactId><version>1.10.6</version></dependency>
- 配置文件
management:endpoints:web:exposure: #暴露所有监控的端点include: '*'
- 访问: http://localhost:8001/actuator/prometheus , 验证,返回 prometheus 格式的所有指标
3.部署 Java 应用
#安装上传工具yum install lrzsz#安装openjdk# 下载openjdkwget https://download.oracle.com/java/17/latest/jdk-17_linux-x64_bin.tar.gzmkdir -p /opt/javatar -xzf jdk-17_linux-x64_bin.tar.gz -C /opt/java/sudo vi /etc/profile#加入以下内容export JAVA_HOME=/opt/java/jdk-17.0.7export PATH=$PATH:$JAVA_HOME/bin#环境变量生效source /etc/profile# 后台启动java应用nohup java -jar boot3-14-actuator-0.0.1-SNAPSHOT.jar > output.log 2>&1 &
确认可以访问到: http://8.130.32.70:9999/actuator/prometheus
4.配置 Prometheus 拉取数据
## 修改 prometheus.yml 配置文件scrape_configs:- job_name: 'spring-boot-actuator-exporter' #应用名称,可自定义metrics_path: '/actuator/prometheus' #指定抓取的路径static_configs:- targets: ['8.130.32.70:9999'] #Java 应用访问 IP + 端口labels:nodename: 'app-demo'
5.配置 Grafana 监控面板
● 添加数据源(Prometheus)
● 添加面板。可去 dashboard 市场找一个自己喜欢的面板,也可以自己开发面板; Dashboards | Grafana Labs