[目录]
参考
springcloud(五):熔断监控Hystrix Dashboard和Turbine
Spring Cloud 入门教程5、服务容错监控:Hystrix Dashboard
hystrix dashboard Unable to connect to Command Metric Stream解决办法
开发环境
| 名称 | 版本 |
|---|---|
| 操作系统 | Windows 10 X64 |
| JDK | JDK1.8(jdk-8u151-windows-x64) |
| IntelliJ IDEA | IntelliJ IDEA 2018.3 |
| Maven | Maven 3.6.0 |
代码说明
本博客的代码基于 2.Spring Cloud-熔断器 Hystrix 的基础上添加代码
源码下载
见附件
理论知识
Hystrix-dashboard是一款针对Hystrix进行实时监控的工具,通过Hystrix Dashboard我们可以在直观地看到各Hystrix Command的请求响应时间, 请求成功率等数据。但是只使用Hystrix Dashboard的话, 你只能看到单个应用内的服务信息, 这明显不够. 我们需要一个工具能让我们汇总系统内多个服务的数据并显示到Hystrix Dashboard上, 这个工具就是Turbine.
1.pom.xml 添加依赖
相关的依赖项目中之前已经存在,分别是
(1)test-invoice-web/pom.xml
<dependency><groupId>org.springframework.cloud</groupId><!--spring boot 1.X:spring-cloud-starter-hystrix--><artifactId>spring-cloud-starter-netflix-hystrix</artifactId></dependency><dependency><groupId>org.springframework.cloud</groupId><!--spring boot 1.X:spring-cloud-starter-hystrix-dashboard--><artifactId>spring-cloud-starter-netflix-hystrix-dashboard</artifactId></dependency>
(2)test-invoice-clound/pom.xml
<!--Spring Boot 执行器组件--><dependency><groupId>org.springframework.boot</groupId><artifactId>spring-boot-starter-actuator</artifactId></dependency>
2.启动类添加注解(test-invoice-web)

package com.test.invoice;import org.springframework.boot.SpringApplication;import org.springframework.boot.autoconfigure.SpringBootApplication;import org.springframework.cloud.client.circuitbreaker.EnableCircuitBreaker;import org.springframework.cloud.netflix.eureka.EnableEurekaClient;import org.springframework.cloud.netflix.hystrix.dashboard.EnableHystrixDashboard;import org.springframework.cloud.openfeign.EnableFeignClients;/*** 启动类** @author:* @version:* @date: 2019-08-12 14:43*///禁用 security 验证@SpringBootApplication(exclude = org.springframework.boot.autoconfigure.security.servlet.SecurityAutoConfiguration.class)@EnableFeignClients //使用feign客户端,https://blog.csdn.net/andy_zhang2007/article/details/86680622@EnableEurekaClient //启用服务注册与发现//modify by v_hwhao 20190828 加入熔断监控Hystrix Dashboard和Turbine@EnableHystrixDashboard //启用 Hystrix Dashboard@EnableCircuitBreaker //开启熔断器功能public class WebApplication { //extends SpringBootServletInitializerpublic static void main(String[] args){SpringApplication.run(WebApplication.class,args);}}
3.启动项目,访问 http://localhost:8080/enta/api/hystrix/
启动项目 test-invoice-eureka
启动项目 test-invoice-service
启动项目 test-invoice-web
如果不知道怎么启动多个项目,可参考
项目启动成功后,访问 http://localhost:8080/enta/api/hystrix/
看到如下界面
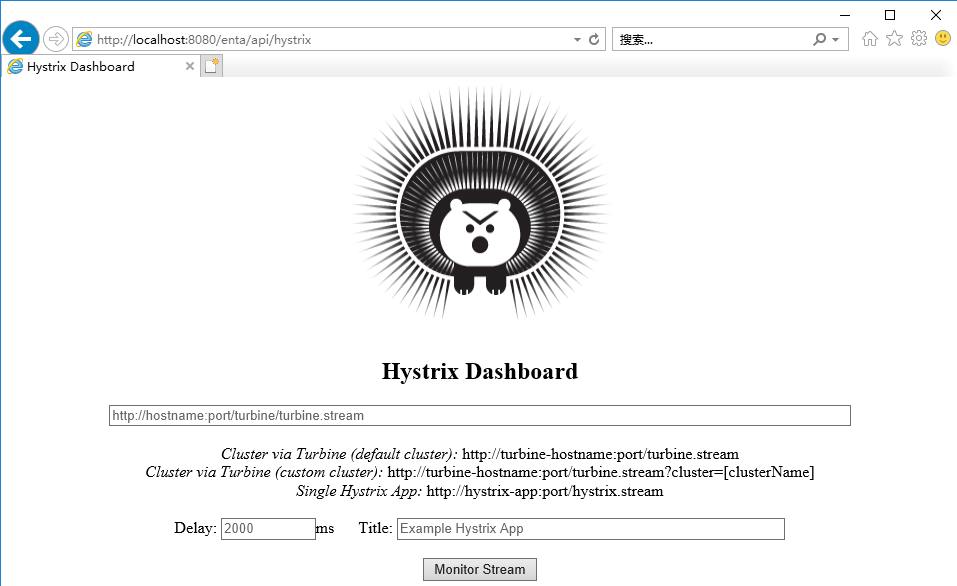
图中的提示
Cluster via Turbine (default cluster): http://turbine-hostname:port/turbine.streamCluster via Turbine (custom cluster): http://turbine-hostname:port/turbine.stream?cluster=[clusterName]Single Hystrix App: http://hystrix-app:port/hystrix.stream
默认集群使用第一个url:http://turbine-hostname:port/turbine.stream指定集群使用第二个url: http://turbine-hostname:port/turbine.stream?cluster=[clusterName]单个应用的监控使用最后一个: http://hystrix-app:port/hystrix.stream
4.填写信息,开始监控
http://localhost:8080/enta/api/hystrix.streamDelay:100Title:service-feign-web
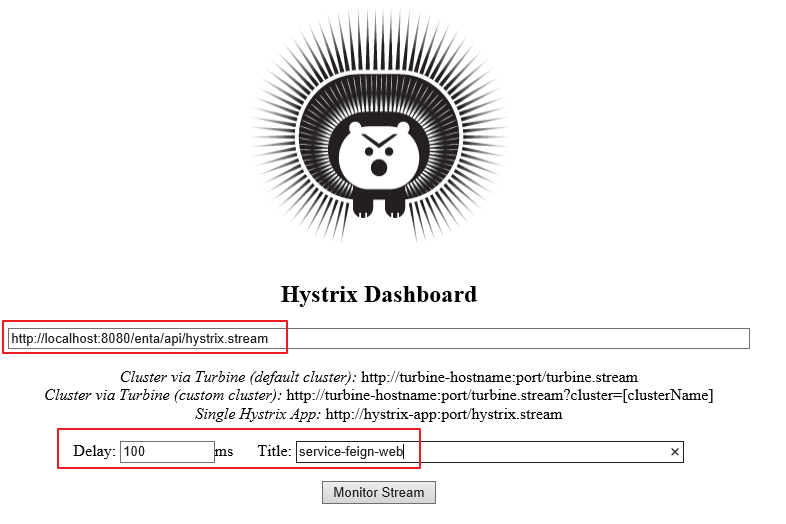
(1)IE 浏览器
点击 Monitor Stream
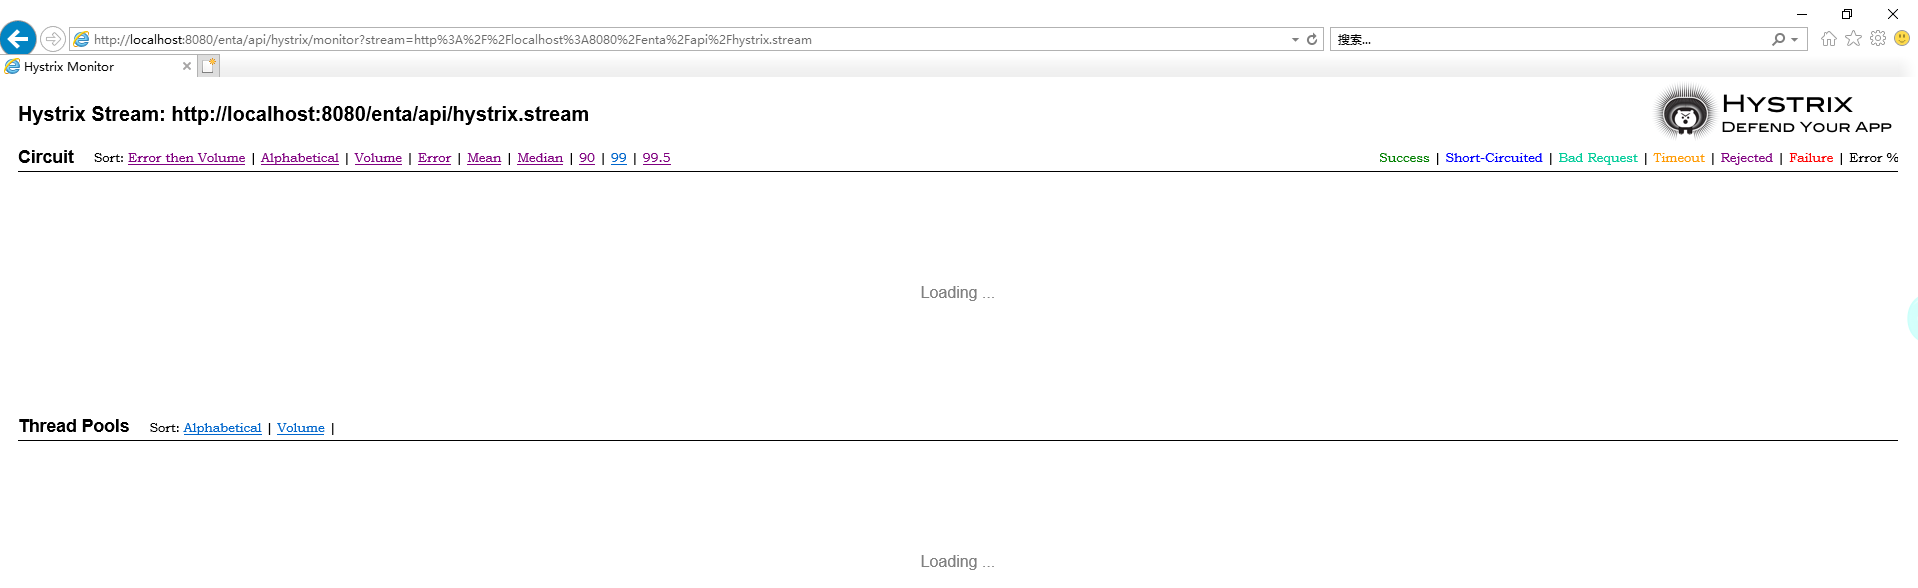
使用 Postman 访问接口 http://localhost:8080/enta/api/Inv/Api/Test/Get
参数
{"id":"","name":"测试数据-菲克-1","version":""}
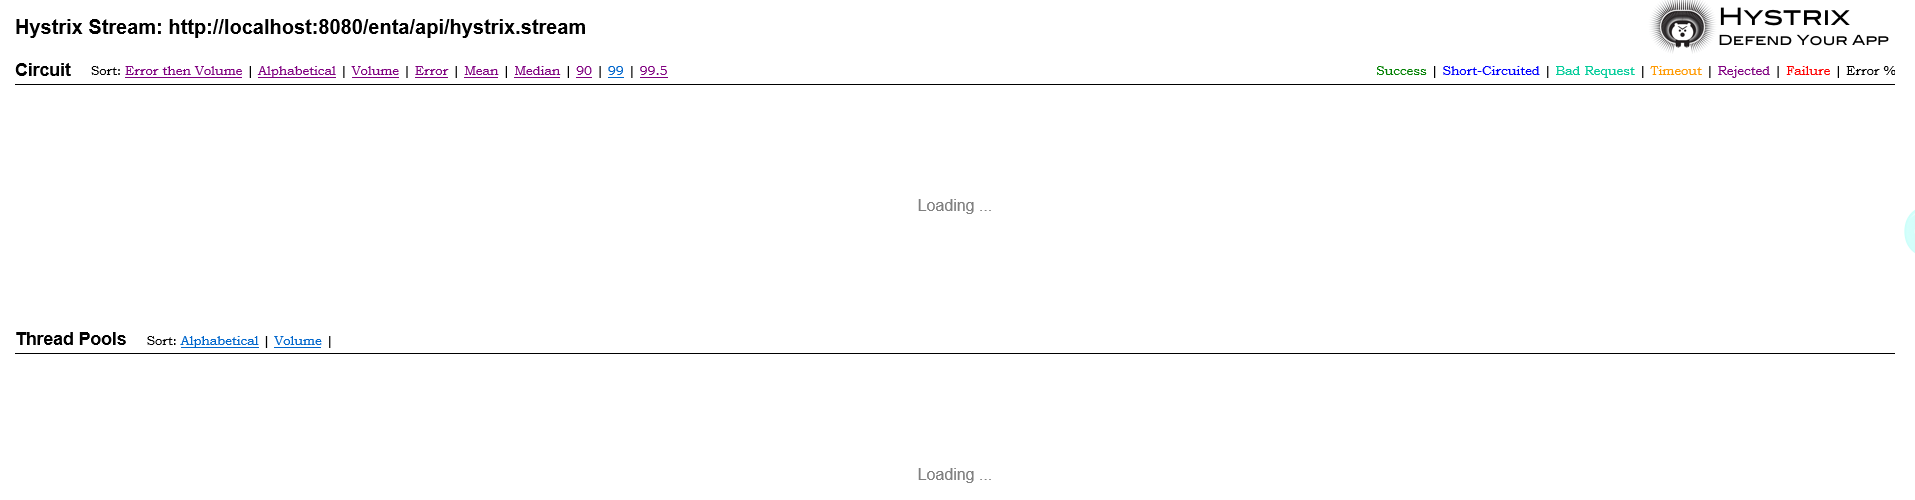
一直都显示 Loading...
Loading… 问题解决
我想写十万个CNM。。。。
最近自己在学spring cloud刚好学到hystrix以及hystrix dashboard就自己写了例子,结果那个图一直显示loading,网上找了好多资料不行,又去spring官网看资料,感觉自己写的没什么问题可死活就是不出了,搞了两个晚上我都已经绝望了
可是,我用Google浏览器试了一下结果出来了,出来了,出来了
我之前一直是用edge,原来是浏览器的问题,可是我网上查了那么多问题没有一个人说浏览器,而且官网也没说,我也是醉了
所以在此提醒有个问题的朋友,不要在像我一样走这么多弯路
一定要用Google浏览器
一定要用Google浏览器
一定要用Google浏览器
(2)Chrom 浏览器
切换到 Chrom 浏览器,点击 Monitor Stream

Unable to connect to Command Metric Stream.问题解决
参考
hystrix dashboard Unable to connect to Command Metric Stream解决办法
test-invoice-web 项目新增配置类 HystrixConfig
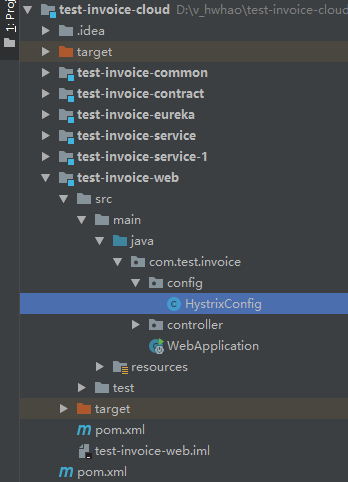
package com.test.invoice.config;import com.netflix.hystrix.contrib.metrics.eventstream.HystrixMetricsStreamServlet;import org.springframework.boot.web.servlet.ServletRegistrationBean;import org.springframework.context.annotation.Bean;import org.springframework.context.annotation.Configuration;/*** 熔断器配置** @author:* @version:* @date: 2019-08-29 19:54*/@Configurationpublic class HystrixConfig {@Beanpublic ServletRegistrationBean getServlet() {HystrixMetricsStreamServlet hys = new HystrixMetricsStreamServlet();ServletRegistrationBean source = new ServletRegistrationBean(hys);source.setLoadOnStartup(1);source.addUrlMappings("/hystrix.stream");source.setName("HystrixMetricsStreamServlet");return source;}}
重启项目 test-invoice-web,刷新页面
页面刷新后,变成了
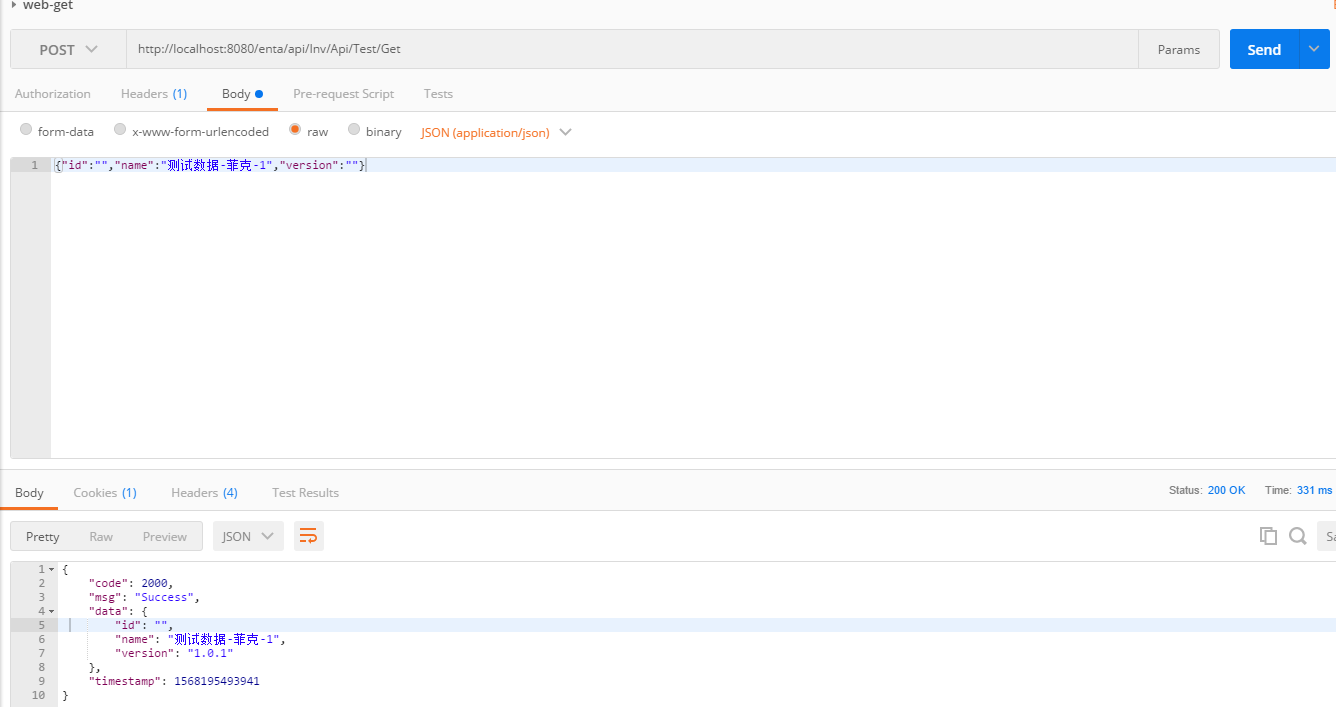
5.使用 Postman 调用接口
使用 Postman 访问接口 http://localhost:8080/enta/api/Inv/Api/Test/Get
参数
{"id":"","name":"测试数据-菲克-1","version":""}
6.刷新页面
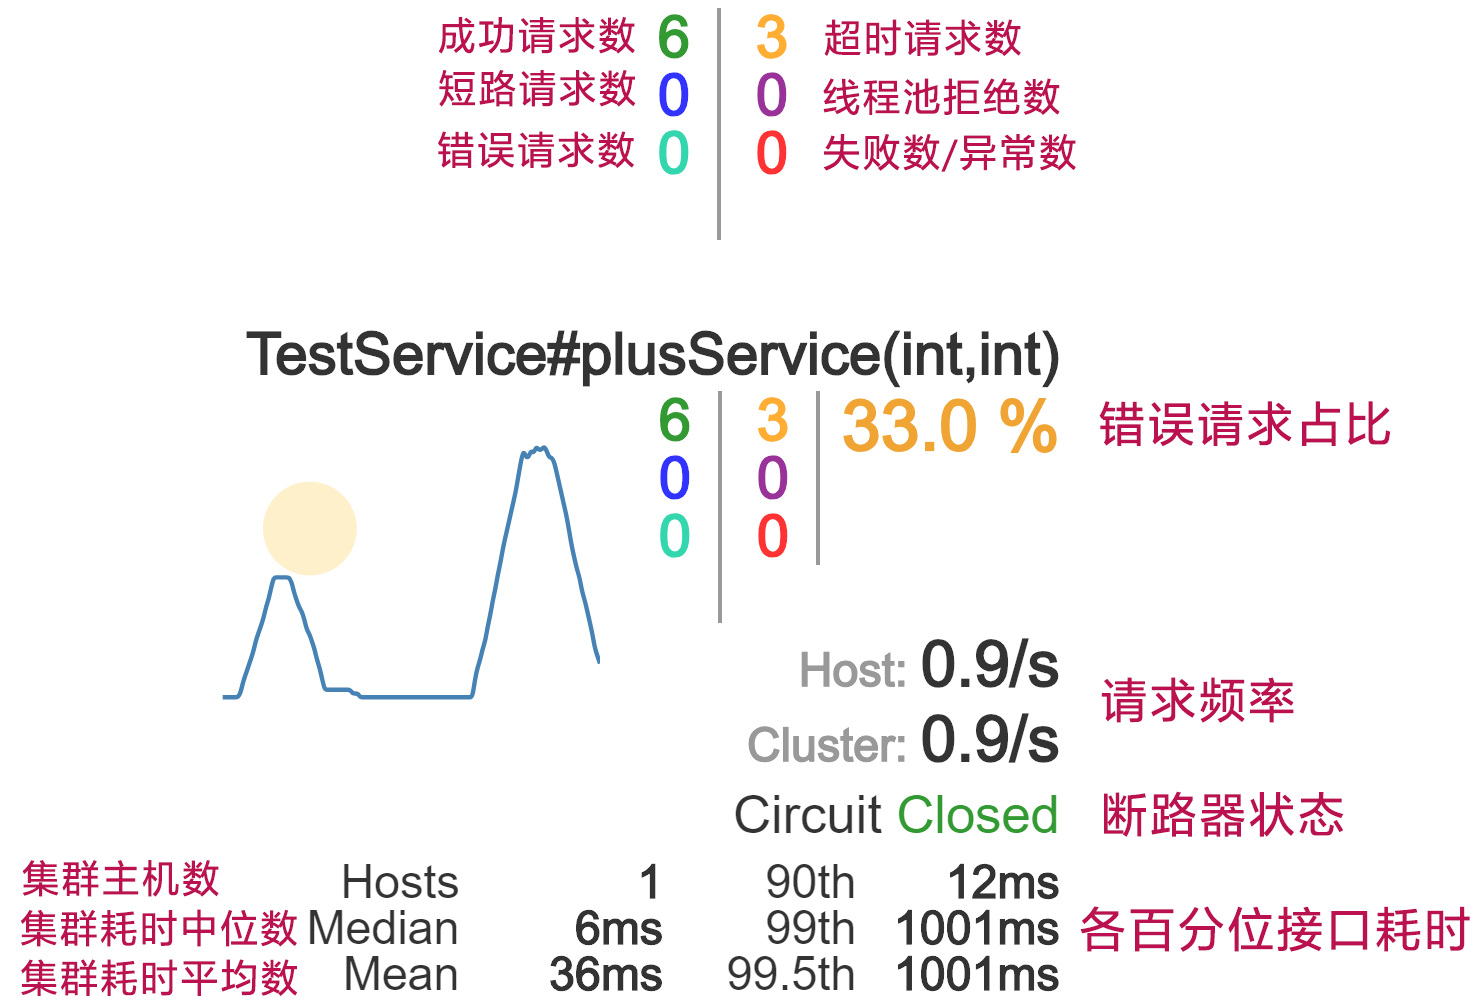
刷新,页面变成了
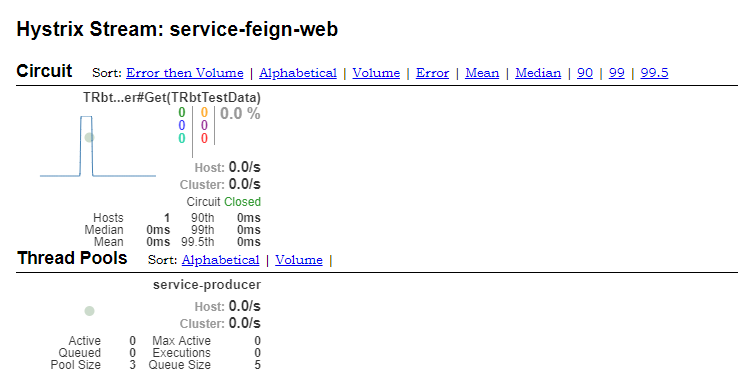
到此单个应用的熔断监控已经完成。
7.图例